“I want my organization to be data-driven,” said the CEO of a medium-sized manufacturing organization. This was the early stages of the pandemic, and we were on our second Zoom meeting.
His organization had begun its digital makeover when COVID hit. With manufacturing plants spread across the country and a customer base that was increasingly digital, the CEO understood the importance of data.
His enthusiasm was evident when he asked me, “How can my team use machine learning to improve business outcomes?”
While executive interest in data was music to my ears, I simultaneously sensed alarm bells going off in my mind.
When should you begin your data science journey?
In my earlier conversations with his team, I found that most of their data were still on paper. Their small digital footprint was handled manually in spreadsheets. But, the business teams had little interest in excel reports or using them for decisions.
The organization lacked quality data and the maturity for simple descriptive insights, whereas the CEO was aspiring a big push into data science.
Such disconnect is widespread in organizations.
Why is data quality important?
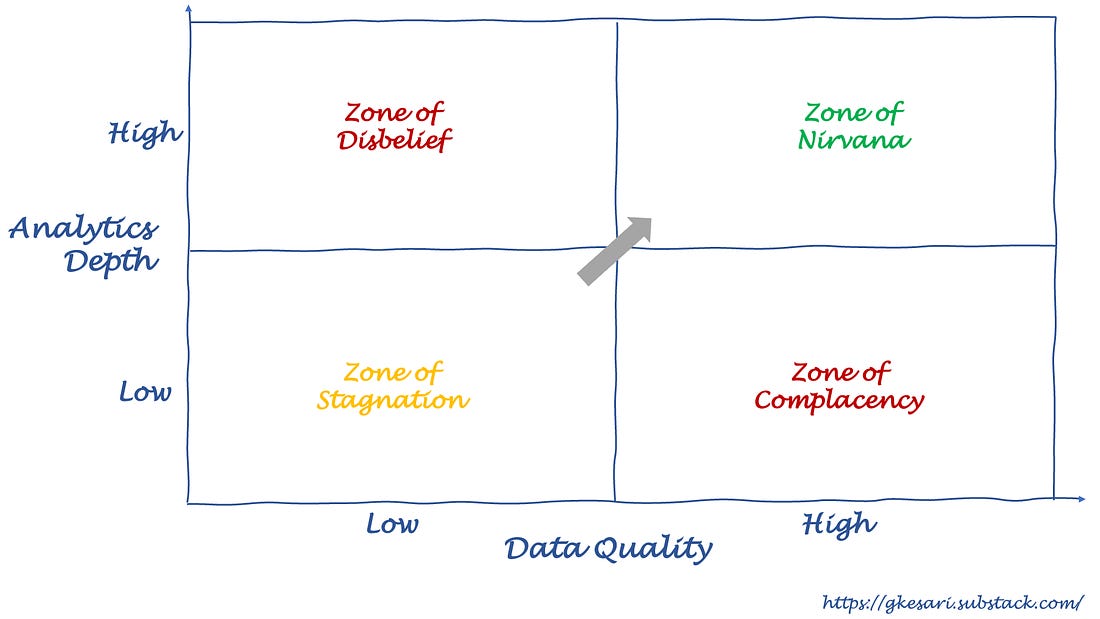
Answering this question will help you avoid failure and disillusionment in your data science journey. Here’s a framework to help you place this in perspective.
(Picture: Data quality vs Analytics depth – 2×2)
This chart shows data quality on the x-axis and analytics depth on the y-axis. Here’s what the four quadrants mean:
- Zone of stagnation (bottom left): Here, both data quality and analytics depth are low. This is where all companies get started. Unfortunately, many stagnate there when they don’t prioritize data engineering and investments in analytics.
- Zone of disbelief (top-left): Here, data quality is low, but analytics depth is high. Imagine running predictive algorithms on questionable data. This always leads to user disbelief.
- Zone of complacency (bottom-right): Most large organizations live here: high on data quality but low on analytics depth. They use gigabytes of neatly curated data to churn out elementary MIS reports while refusing to step up their analytics maturity. What a waste of potential?
- Zone of nirvana (top-right): This is where all organizations aspire to get to. They have high availability of good quality data and can analyze them for deep insights. Getting here is a marathon.
Do you trust your data?
The manufacturing CEO attempted to get to the ‘zone of disbelief’ – acquiring machine learning ability without raising their data quality.
To highlight the disconnect, I asked him, “Let’s say a machine learning model reveals a groundbreaking insight about your production process. Will you make a high-stakes decision based on this finding?”
The CEO thought for a while and said, “I’d be cautious – it will make me curious but not confident enough to act on the recommendation.”
When probed further, he finally said the magical phrase, “I wouldn’t trust the data.”
When a hidden analytics insight fails to raise our curiosity but instead raises doubts about the data, we might have just put the cart before the horse.
I politely told the executive that they might be early for machine learning.
So, the next time you find an organization in the ‘disbelief’ zone demanding advanced analytics (or AI), ask them this one question:
“Will you make a high-stakes decision if your algorithm stumbles upon a ground-breaking insight?”
Unless they say “hell yeah,” they are not ready for advanced analytics. Save them time and money by putting them on the path to cleaning up their data first.
—
How can a firm starting in the ‘zone of stagnation’ reach ‘nirvana’ without slipping into the zones of ‘disbelief’ or ‘complacency’? No, they need not hit the brakes on analytics. Check out this post on how to pursue data science even if you don’t have big data or AI skills.


