Have you come across organizations that pour money into data science before getting their data in place? My earlier post talked about a manufacturing organization that attempted just that.
How not to begin your data science journey
I shared *one* question to help spotlight this disconnect and convince leaders against burning their money. (Read the post -> when to pursue data science)
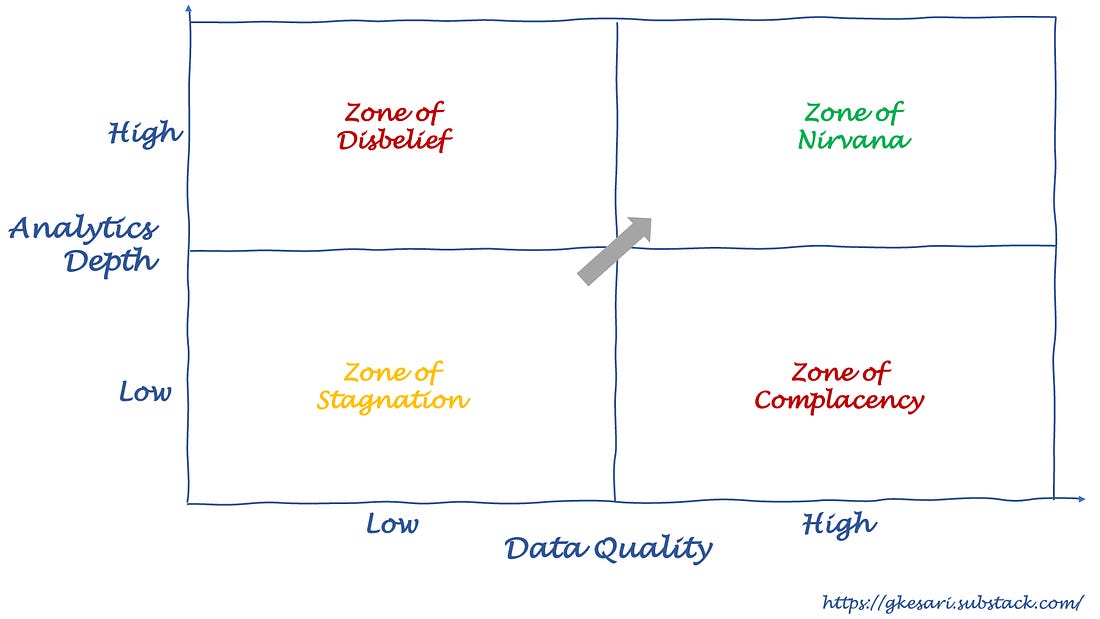
We walked through a simple yet powerful framework to help you get the most from your big data and analytics investments. (See the 2×2 quadrant below)
When you review the poor ROI of advertising campaigns, if your marketing team has disowned the underlying data, you’ve been in the ‘zone of disbelief.’ When a team painstakingly runs customer surveys, stores all customer interactions but uses them for basic summary reporting, they are in the ‘zone of complacency.’
Most organizations start with a clean slate, on the bottom-left. How do they reach the ‘zone of nirvana’ without slipping into the zones of ‘disbelief’ or ‘complacency’?
Yes, you must steer clear of AI until you get the data in place. But you need NOT shelve all analytics efforts until you build a perfect data warehouse.
How to level up in your data quality and big data analytics?
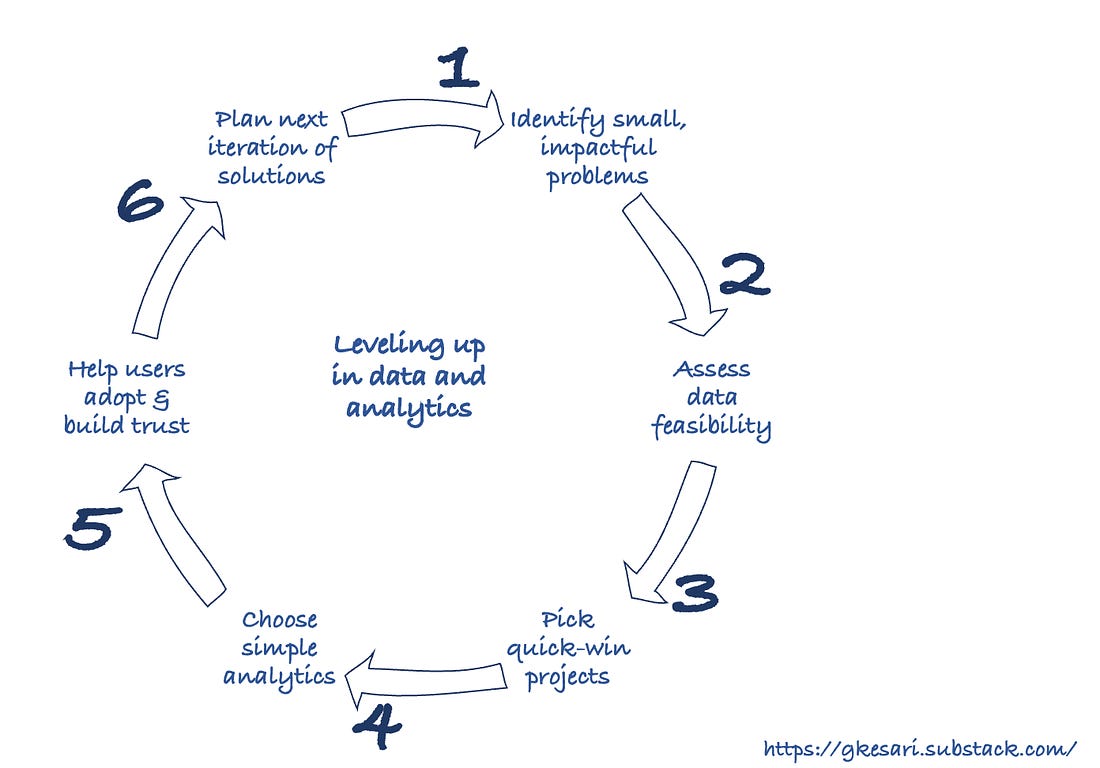
You must parallel-track data and analytics (D&A). Focus on incremental gains to level up in your D&A maturity. Here’s a 6-step iterative process to help you get there:
1. Identify small, impactful problems: Identify the target audience and their short-term business problems. Ensure that addressing them will deliver business impact. For example, find which advertising channel offers the most bang for the buck.
2. Assess data feasibility: Assess the data needs of each initiative. Some moonshot projects may have no data. If it aligns with your strategy, plan for data acquisition in the future. Note down projects for which data is immediately available.
3. Pick quick wins: Based on the business impact and feasibility, pick projects that can be executed immediately – these are your quick wins. If predicting customer churn needs time, diagnosing factors that cause churn could be done earlier.
4. Choose simple analytics: Find out how to achieve project outcomes with the simplest analytics techniques and existing skills/tools. Early on, these could be descriptive or diagnostic analytics done on tools such as MS Excel.
5. Help users adopt & build trust: Make insights consumable and help users adopt them. Partner on change management and help build user trust in data. This takes time. For example, embed data stories in a business workflow for ready actioning.
6. Plan the next iteration: Build a roadmap of incremental solutions and features to meet your users’ rising appetite for insights. Revisit the business initiatives to see your new ‘quick wins’ and which additional skills you can acquire next.
Rinse and repeat this process to keep moving along the diagonal in the earlier chart, towards the ‘zone of nirvana.’ As your data quality and analytics depth rise, so will your business value.
Leaders often bet their careers on big-bang data science projects but forget to leverage the power of small gains. Remember the 1% improvement rule from ‘Atomic Habits’?
If you can get 1 percent better each day, you’ll end up thirty-seven times better by the end of the year.
Small habits are underestimated. So are small wins in data and analytics.


